

The product tour
Four features, four fewer chores
Every part of Trace exists to shorten the distance between a number moving and someone knowing why.
Funnels
Unified funnels
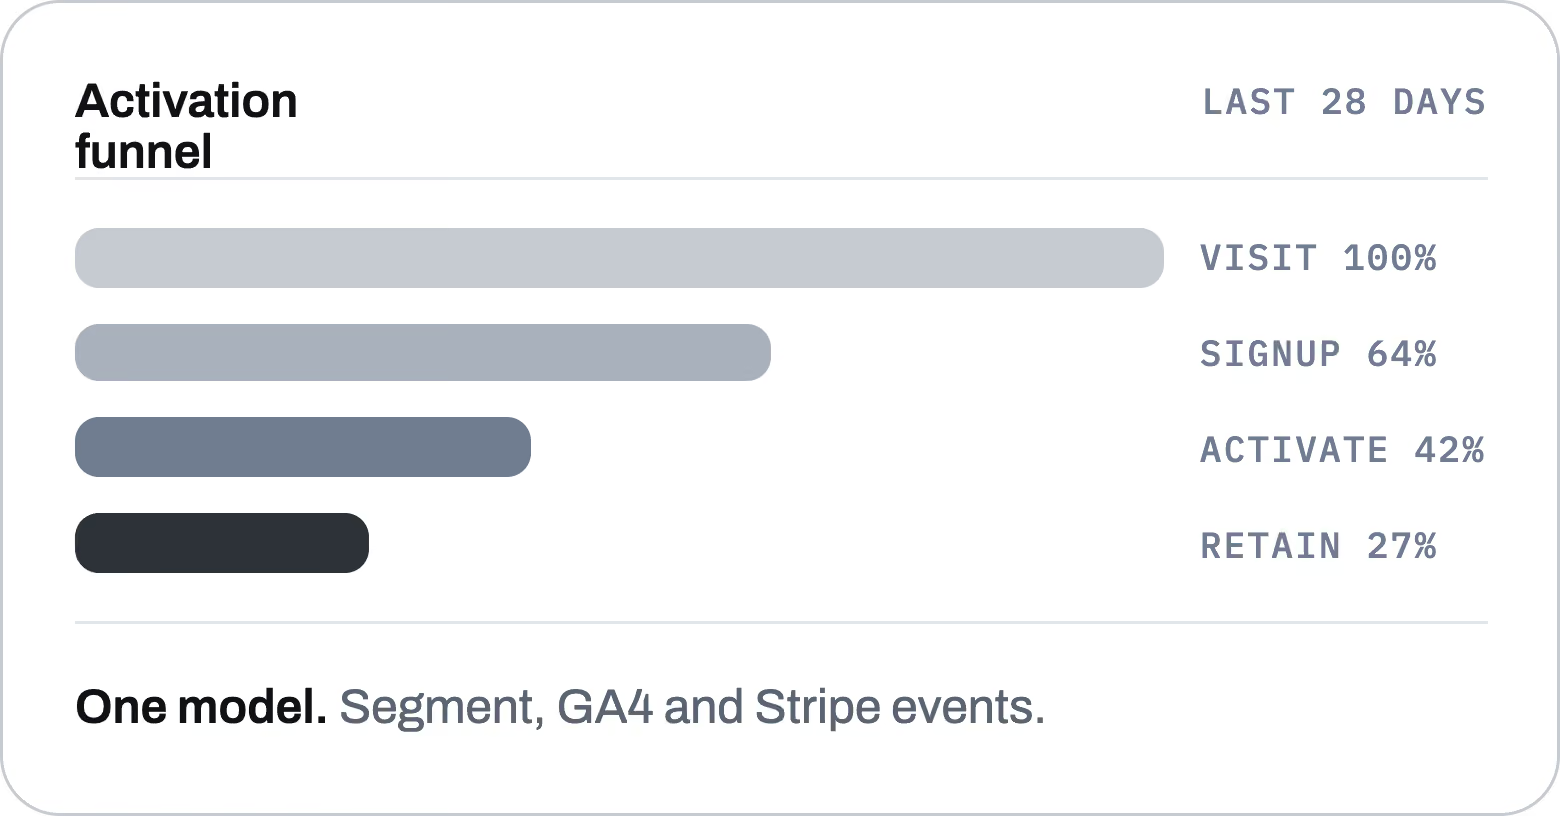
Read product, marketing, and revenue events as one funnel — without stitching three dashboards together or arguing over which number is the real one.
Included
Product, marketing, and revenue events in a single model
Visit → signup → activate → retain, with drop-off at each hop
StreamLane and Ledgerly as first-class sources
Connected in about 10 minutes, with no SDK rewrite
Alerts
Anomaly alerts
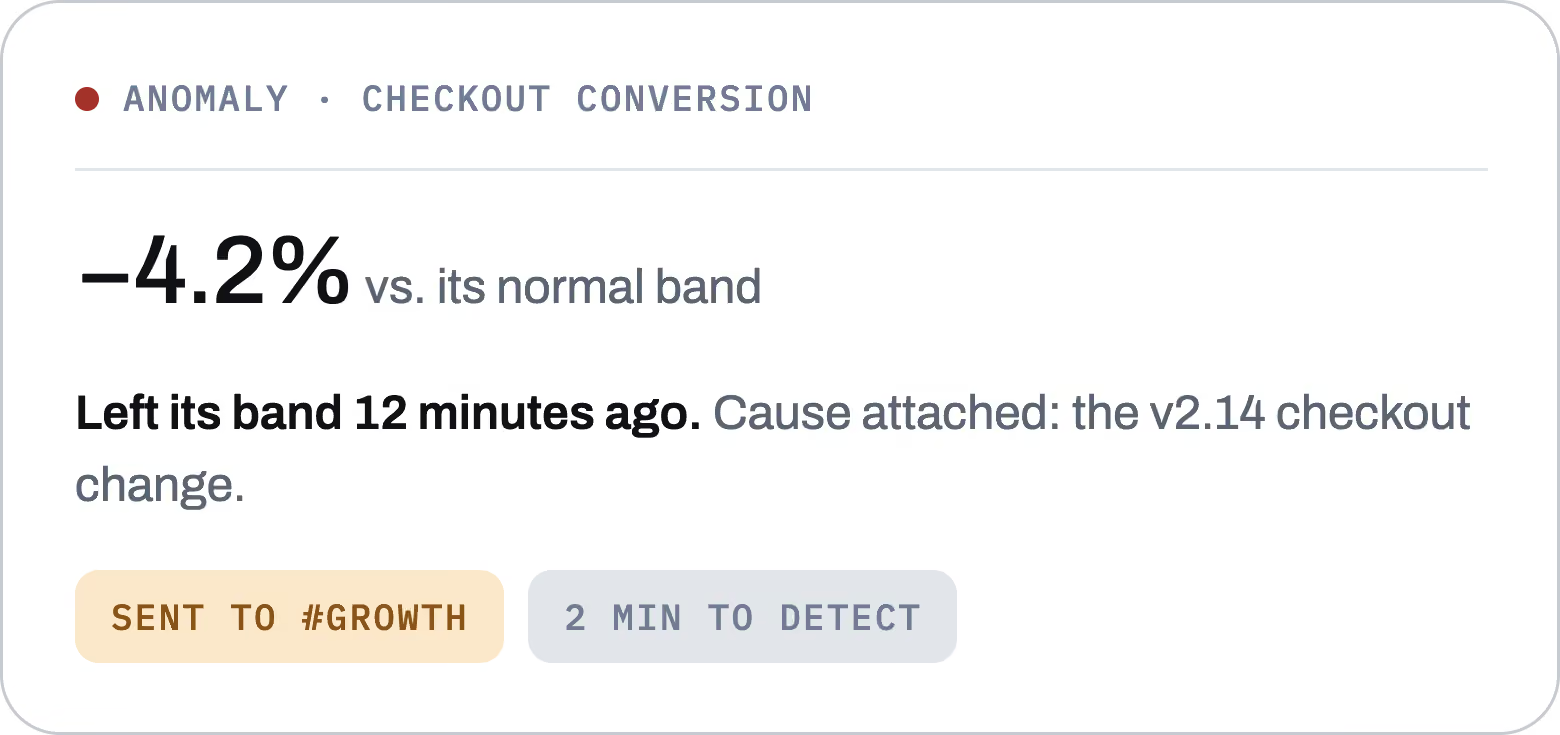
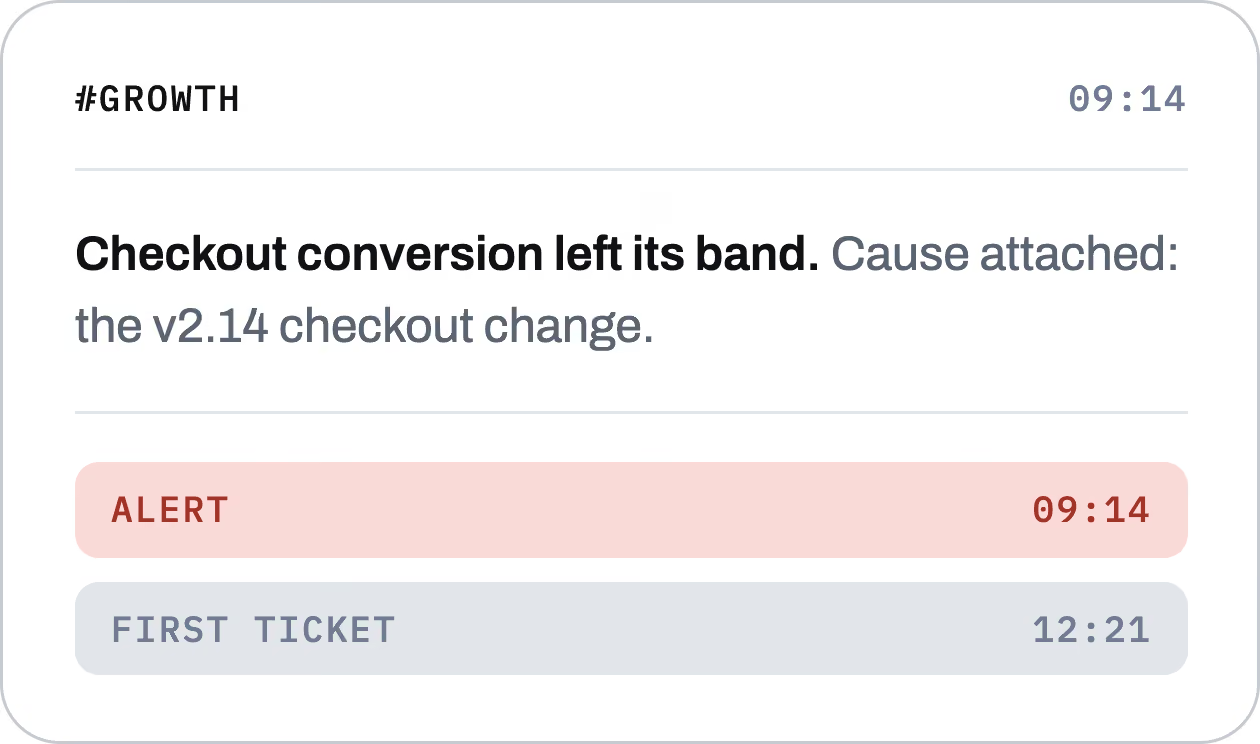
Hear about a metric the moment it leaves its band — without waiting for someone to spot it in Monday's report, three days after the deploy that caused it.
Included
Learned bands per metric instead of static thresholds
Alerts routed to a Signalroom channel with the cause attached
GitHarbor deploys annotated on every metric
About two minutes from the event landing to the alert
Explain
AI explanations
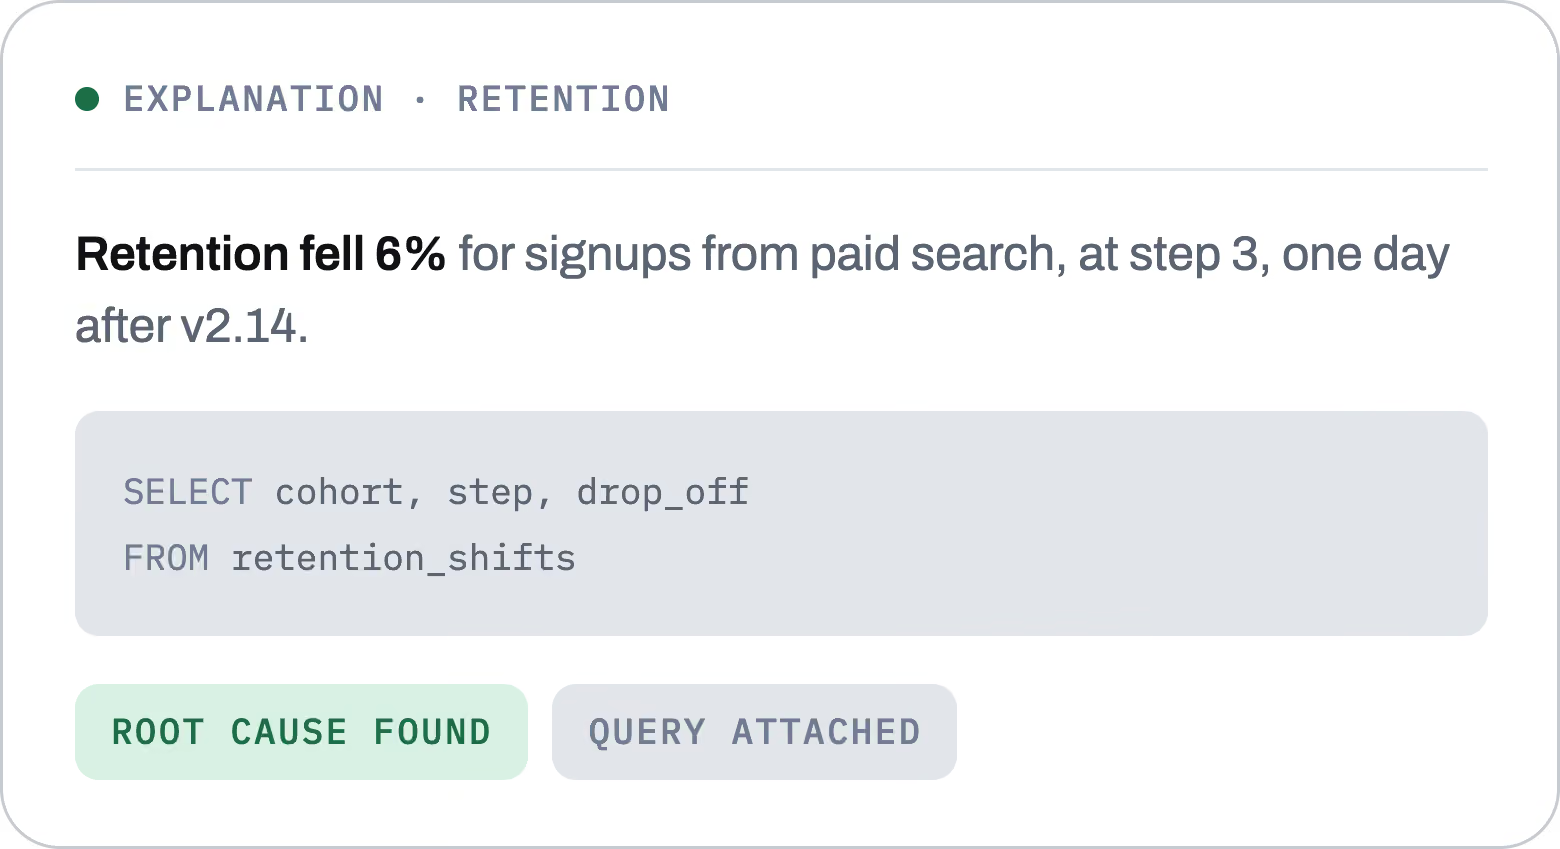
Get the cause of a shift in a sentence — without writing the six exploratory queries it normally takes an analyst to get there.
Included
The root cause named, with the cohort it happened to
The underlying query attached to every explanation
Each release tied to the metrics that deploy moved
Rated 94% helpful on average by the teams using them
Warehouse
Warehouse-native
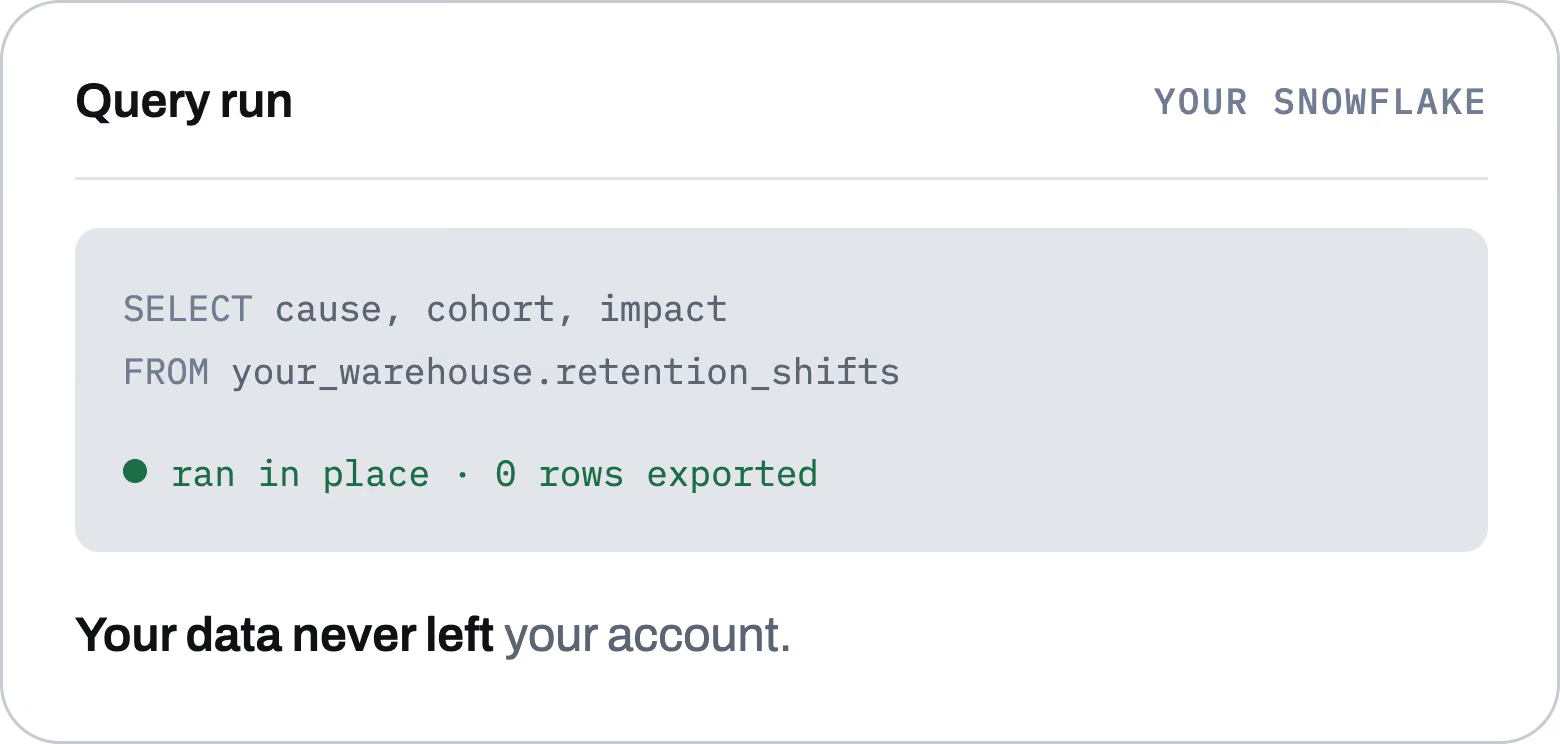
Run every query inside the warehouse you already own — without handing a second copy of your customer data to another vendor.
Included
Queries execute in your GlacierDW or ColumnCloud
Zero rows exported on the Scale plan
Events stored encrypted in your region on Starter and Pro
A REST API for anything the native sources miss


Questions?
We're glad you asked.
How long does setup take?
Most teams connect a data source and see their first AI explanation in under 10 minutes. Warehouse-native mode takes about an hour with your data team.
Does my data leave my warehouse?
On the Scale plan, never — all queries run inside your GlacierDW or ColumnCloud. On Starter and Pro, events are stored encrypted in your region.
Which tools does it integrate with?
StreamLane, Ledgerly, GitHarbor deploys, and Signalroom for alerts. A REST API covers everything else.
Can I change or cancel my plan anytime?
Yes — upgrades apply instantly, downgrades at the end of the billing cycle. No lock-in, export your data anytime.
How accurate are the AI explanations?
Every explanation links to the underlying query and cohort so you can verify it. Teams rate explanations 94% helpful on average.


.svg)

